Przejdź do zawartości
Facebook
Twitter
YouTube
Instagram
Home
Aktualności
Gry
Relacje inwestorskie
I. Działalność Spółki
II. Władze Spółki
III. Akcjonariat
IV. Strategia rozwoju
V. Struktura przychodów
VI. Wyniki finansowe
VII. Raporty
EBI
ESPI
Okresowe
VIII. Otoczenie rynkowe
IX. Prezentacje
X. Notowania
XI. Dokument informacyjny
XII. Kalendarium
XIII. Ład korporacyjny
XIV. Walne zgromadzenie
XV. Dane kontaktowe
XVI. Harmonogram premier
O nas
Kontakt
Struktura przychodów
Strona główna
/
Relacje inwestorskie
/
Struktura przychodów
Struktura przychodów
UF GAMES S.A.
2026-03-27T14:03:43+01:00
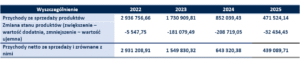
Struktura rodzajowa przychodów netto ze sprzedaży Emitenta w latach 2022-2025 (w zł)
Źródło: Emitent
Page load link
Przejdź do góry